Ever wonder which neighborhoods in Los Angeles grew up first?
There’s a map for that.
advertisements

Using public data sources from local governments Built:LA visualizes the age of an estimated 3 million buildings across L.A. County that were built between 1890 and 2008. The color-coded result allows users to cruise the entire landscape of Los Angeles, observing not just the general ages of neighborhoods (light blue is oldest, pink/orange is youngest) but allowing the ability to zoom in and check the ‘birth’ year of individual buildings.
One of the coolest features of the map is the time-lapse button (it’s the rainbow wheel looking thing). Hit the button to observe the decade-by-decade the spawning of housing development throughout Los Angeles County.
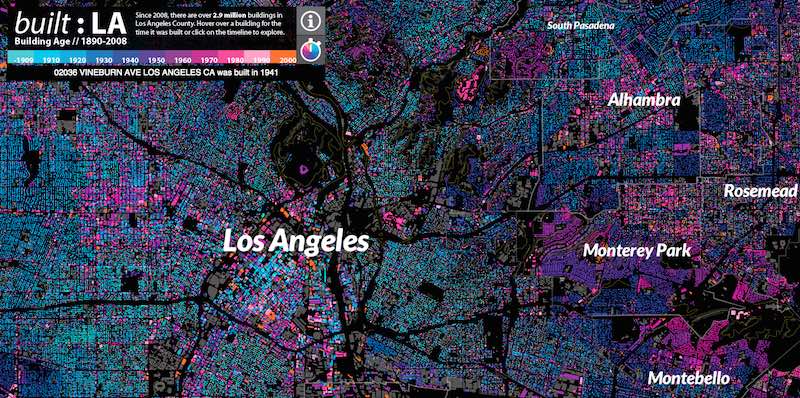
Unfortunately, you can’t search the database via address (it doesn’t exactly navigate like a Google Map) but still it’s a very neat visualization of data.
Built:LA was developed by Omar Ureta of the Urban Policy Collective and made with Mapbox Studio and Mapbox-GL.
[h/t CityLab]
advertisements